When students first encounter irrational numbers, the concept of a never-ending, non-repeating decimal can feel completely abstract. Visual estimation diagrams for approximating radical values solve this problem by turning invisible numbers into physical shapes. Instead of just memorizing that the square root of 10 is about 3.16, learners can actually see it by comparing the area of a 10-square-unit shape to perfect squares. This geometric approach builds genuine number sense and helps students understand the physical space that numbers occupy.
What exactly are visual estimation diagrams?
At their core, these diagrams use geometry to estimate non-perfect square roots. The most common method involves area models. If you want to estimate the square root of 20, you draw a square with an area of 20. Then, you compare it to a 4x4 square with an area of 16 and a 5x5 square with an area of 25. Because 20 is closer to 16 than 25, the side length and therefore the square root must be closer to 4 than 5. Teachers often pair these geometric models with a number line to show exactly where the irrational number sits between whole numbers.
When should you use geometric models instead of a calculator?
Calculators are great for getting a quick answer, but they skip the learning process. You should use visual diagrams when introducing the concept of radicals for the first time. It is also highly effective when students need to understand the relative size of irrational numbers. For instance, if a math problem asks which is larger the square root of 50 or 7 a student who has practiced with area models can instantly picture a 50-unit square next to a 7x7 square, which has 49 units, and know the answer without doing any long division. If you need structured practice for this, a dedicated worksheet focusing on geometric diagrams can help reinforce the concept through repetition.
How do you draw an area model for a non-perfect square?
Let us walk through estimating the square root of 12 using a simple step-by-step process.
- Identify the closest perfect squares. For 12, those are 9 (a 3x3 square) and 16 (a 4x4 square).
- Draw a 3x3 grid and a 4x4 grid on graph paper.
- Shade 12 squares inside the 4x4 grid.
- Observe the leftover space. You have 3 full rows and 3 extra squares shaded.
- Estimate the side length. Since 12 is about one-third of the way between 9 and 16, the square root is roughly 3.3 or 3.4.
To make this easier to display on a whiteboard, many educators rely on a pre-made estimation chart designed for classroom instruction so they do not have to draw grids from scratch every single time.
What are the most common mistakes students make?
Even with visual aids, learners can trip up on a few specific concepts when estimating radicals.
- Confusing area with side length: Students often think the square root of 20 is 10 because they divide 20 by 2. Remind them that the square root is the side length of the square, not half the area.
- Assuming linear spacing: A major error is thinking the square root of 20 is exactly halfway between 4 and 5 just because 20 is halfway between 16 and 25. The relationship between side length and area is not perfectly linear. Visual diagrams help show that the spacing on a number line gets slightly compressed as numbers get larger.
- Relying only on memorization: Trying to memorize the decimal values of square roots up to 100 defeats the purpose of the exercise. The goal is approximation and spatial reasoning, not rote memorization.
How can you make estimating irrational numbers more engaging?
Math can feel dry if it is just numbers on a page. Bringing in hands-on activities changes the dynamic. You can have students cut out physical paper squares and try to arrange them into larger, imperfect squares to see the physical gaps. If you are creating your own custom handouts for these activities, using a highly legible, clean typeface like Century Gothic makes the grids and numbers much easier for younger students to read. You can also turn the lesson into a game by having students guess the decimal value of a radical and then measuring the actual side length of their drawn shapes with a ruler to see who got the closest. For a more structured game-based approach, try using visual diagrams to estimate irrational numbers in an interactive activity that gets students moving and collaborating.
Your next steps for teaching visual radical estimation
Before moving on to algebraic applications of radicals, make sure your students have a solid visual foundation. Use this quick checklist to guide your next lesson:
- Start with perfect squares using physical tiles or graph paper before introducing non-perfect squares.
- Always ask students to identify the bounding perfect squares out loud before they draw the diagram.
- Connect the 2D area model directly to a 1D number line so they can translate the shape into a linear position.
- Check their understanding by asking them to explain why their estimate makes sense, rather than just grading the final decimal number.
 Square Root Approximation Chart for Visual Estimation
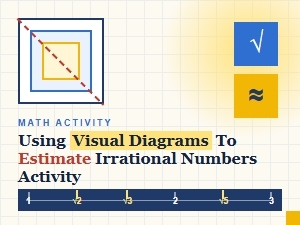 A Visual Guide to Estimating Irrational Numbers
 A Visual Lesson Plan for Estimating Square Roots
 Visual Estimation Diagrams for Radicals Worksheets
 Quick Methods for Mentally Approximating Square Roots
 Mental Math Strategies for Approximating Irrational Numbers