When students first encounter irrational numbers, the concept of a square root that does not result in a clean whole number can feel entirely abstract. A worksheet on estimating radicals using geometric diagrams bridges this gap by turning algebraic symbols into physical space. Instead of just memorizing that the square root of 10 is roughly 3.16, students draw a square with an area of 10 and compare it to perfect squares. This physical representation makes the math real and gives learners a concrete way to visualize numbers that do not fit neatly into standard arithmetic.
What Does This Worksheet Actually Teach?
The core idea relies on area models. If a student needs to estimate the square root of 20, they sketch a square representing an area of 20. They then place it between a 4 by 4 square (area 16) and a 5 by 5 square (area 25). This visual boundary immediately tells them the side length must be between 4 and 5. By looking at how much extra area spills past the smaller square, they can reasonably guess the decimal. It shifts the focus from memorizing steps to understanding spatial relationships.
When Should Teachers Use Visual Estimation Activities?
You will get the most out of these exercises right after students master perfect squares but before they rely on calculators. When introducing the topic, running an activity that uses visual diagrams to estimate irrational numbers helps ground the math in reality. If students jump straight to decimal approximations, they miss the spatial relationship between the numbers and often treat the process as a random guessing game.
How Do Students Solve These Problems Step-by-Step?
Let us look at estimating the square root of 30. The process follows a logical sequence that builds number sense.
- Identify bounding perfect squares: The student finds the closest perfect squares, which are 25 and 36.
- Draw the geometric squares: They sketch a 5 by 5 grid and a 6 by 6 grid on their paper.
- Compare the areas: The target area, 30, is 5 units larger than 25, and 6 units smaller than 36.
- Estimate the side length: Since 30 is slightly less than halfway between 25 and 36, the side length will be slightly less than 5.5. Drawing this out makes the fractional estimation logical rather than a blind guess.
What Are the Most Common Mistakes Students Make?
The biggest hurdle is confusing the area of the shape with the length of its sides. A student might correctly identify that 20 falls between 16 and 25, but then assume the square root is exactly 4.5 because 20 is roughly halfway between those two numbers. They forget that the relationship between side length and area is not a straight line.
Another frequent error is confusing square roots with simple division. Some beginners will look at the square root of 10 and guess 5, simply because 10 divided by 2 is 5. Forcing them to draw a 5 by 5 square (area 25) quickly proves why 5 cannot be the square root of 10, correcting the misconception visually.
How Can You Design or Print These Worksheets Effectively?
Layout matters when students are drawing shapes. When building a lesson plan focused on estimating square roots with visual aids, providing pre-printed grid paper saves a lot of time and keeps student work neat. If students have to draw their own grid lines, they often spend more time counting boxes than thinking about the math.
If you are designing your own materials from scratch, using a clean, readable typeface like Poppins ensures the numbers and instructions remain highly legible for younger students. Keep plenty of white space around the drawing areas so students have room to sketch multiple squares without their work overlapping.
How Do You Transition from Diagrams to Number Lines?
Geometric diagrams are the starting point, but the ultimate goal is usually placing these values on a number line. Once students grasp the area concept, using visual estimation diagrams to approximate radical values helps them plot those side lengths accurately on a standard one-dimensional line. They can take the side length they just estimated from their square drawing and mark it directly between the whole numbers on their number line, connecting the 2D area to a 1D position.
Quick Checklist for Your Next Lesson
- Verify that students can instantly recall perfect squares up to 144 before starting the worksheet.
- Provide physical graph paper or pre-printed grids to keep the focus on estimation rather than drawing straight lines.
- Ask students to write out their bounding perfect squares next to their drawings to reinforce the connection between area and side length.
- Have students compare their visual estimates with a calculator at the very end of the class to check their accuracy and build confidence.
 Visual Estimation Diagrams for Radical Approximations
 Square Root Approximation Chart for Visual Estimation
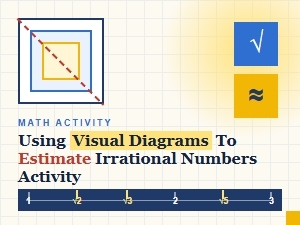 A Visual Guide to Estimating Irrational Numbers
 A Visual Lesson Plan for Estimating Square Roots
 Quick Methods for Mentally Approximating Square Roots
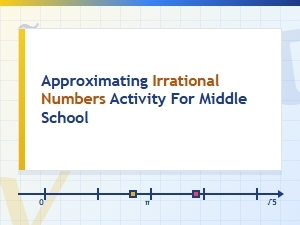 Mental Math Strategies for Approximating Irrational Numbers