When students first encounter irrational numbers, the radical symbol can feel like a roadblock. A square root estimation chart for classroom instruction gives them a visual anchor to make sense of these values. Instead of just memorizing decimals, they learn to see where numbers like the square root of 10 or 15 actually live on a number line. This tool bridges the gap between abstract math and concrete understanding, making it much easier for students to grasp the size and scale of radical expressions.
How does a square root estimation chart actually work?
At its core, this chart maps unknown radical values between known perfect squares. If a student needs to estimate the square root of 20, the chart shows them it falls between 16 and 25. Because the square roots of 16 and 25 are 4 and 5, they instantly know the answer is 4-point-something. Teachers use these visual estimation diagrams to help students approximate radical values without relying immediately on a calculator, building their number sense in the process.
When is the right time to introduce this chart to students?
The best time to bring this tool into your lessons is right before tackling the Pythagorean theorem or graphing irrational numbers on a coordinate plane. Usually, this happens in eighth-grade math. If you are building out your curriculum, pairing the chart with an estimating square roots lesson plan that uses visual aids helps students grasp the concept much faster than lecturing alone. It gives them a physical reference point while they are still learning the underlying rules of exponents and roots.
What does a practical classroom example look like?
Let’s say you want the class to estimate the square root of 30. First, students identify the closest perfect squares: 25 and 36. Next, they find the square roots of those anchors, which are 5 and 6. Since 30 is almost exactly in the middle of 25 and 36, the square root is roughly 5.5. Using visual diagrams to approximate these radical values allows students to plot this point physically on a number line, reinforcing the spatial relationship between the numbers. They can physically see that the distance between squared numbers grows larger as the values increase.
What common mistakes do students make when estimating roots?
Even with a chart, students can fall into a few predictable traps. Watching out for these errors will help you guide them back on track:
- Dividing by two: Many beginners see the square root of 20 and immediately guess 10. The chart corrects this by visually showing the curve of squared numbers, proving the root is much smaller than half the original value.
- Assuming linear spacing: Students often think the square root of 26 is 5.5 because it is close to 25. They forget that the intervals between perfect squares are not evenly distributed on a standard number line.
- Ignoring the lower bound: Some students only look at the higher perfect square and guess randomly below it, rather than anchoring the value securely between both the lower and upper bounds.
How can teachers make the chart more effective?
To get the most out of this tool, print the chart in a large format and keep it visible on the wall. When designing your own materials, using a highly readable, rounded typeface like Fredoka makes the numbers easier for younger students to process from a distance. You can also laminate individual copies for student desks so they can use dry-erase markers to plot points. If you need a ready-made template, downloading a pre-formatted square root chart for classroom instruction saves you time and ensures the number lines are scaled correctly.
Another useful strategy is to have students build their own charts. Give them blank number lines and ask them to plot the perfect squares first. Then, have them calculate and plot a few non-perfect squares. The physical act of drawing the intervals builds a stronger mental model than just looking at a printed page.
What should students do after mastering the chart?
Once your students are comfortable estimating by hand, it is time to test their accuracy and apply the skill to real problems. Here is a practical checklist for your next few lessons:
- Have students estimate five different radical values using the chart.
- Let them use a calculator to find the exact decimal values and compare their estimates.
- Ask them to calculate the margin of error for each guess to see how close they got.
- Introduce a real-world geometry problem, like finding the diagonal of a rectangular TV screen, where they must estimate the square root before measuring the actual object.
Moving from visual estimation to practical application ensures the concept sticks long after the chart is taken down.
Explore Design Visual Estimation Diagrams for Radical Approximations
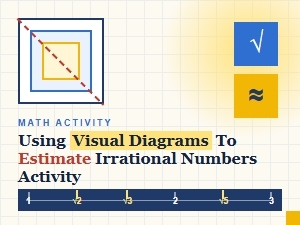 A Visual Guide to Estimating Irrational Numbers
 A Visual Lesson Plan for Estimating Square Roots
 Visual Estimation Diagrams for Radicals Worksheets
 Quick Methods for Mentally Approximating Square Roots
 Mental Math Strategies for Approximating Irrational Numbers